From P Bobik et al. (2006): evaluation of the Transmission Function in different geomagnetic regions.
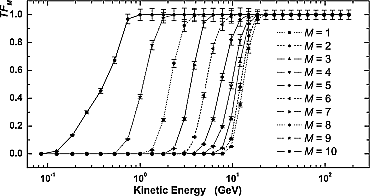
Fig. 2. Transmission function (TFM as a function of the geomagnetic region M) evaluated for AMS-01 regions during the STS-91 mission flight time (June 1998) as a function of the proton kinetic energy in GeV. The lines are to guide the eye.
From P Bobik et al. (2009): Transmission Function for different cosmic ray species in different geomagnetic region.
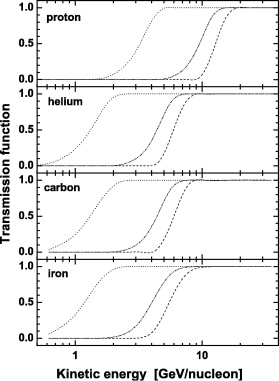
Fig. 4. Transmission function of p, He, C and Fe for the geomagnetic regions M1 (dot line), M4 (dash-dot-dot line) and M7 (dash line).
From P Bobik et al. (2013) presented at ICRC-2013 Conference: differences between Internal and External magnetic field using the GeoMagSphere backtracing for the determination of the final point.
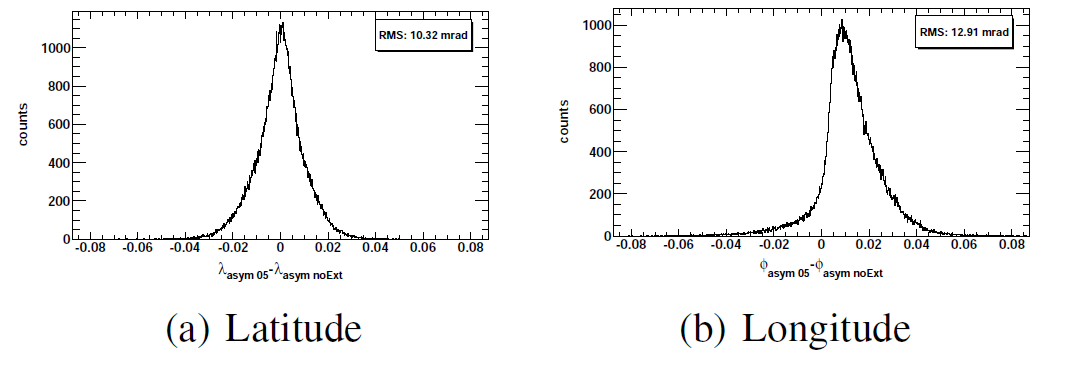
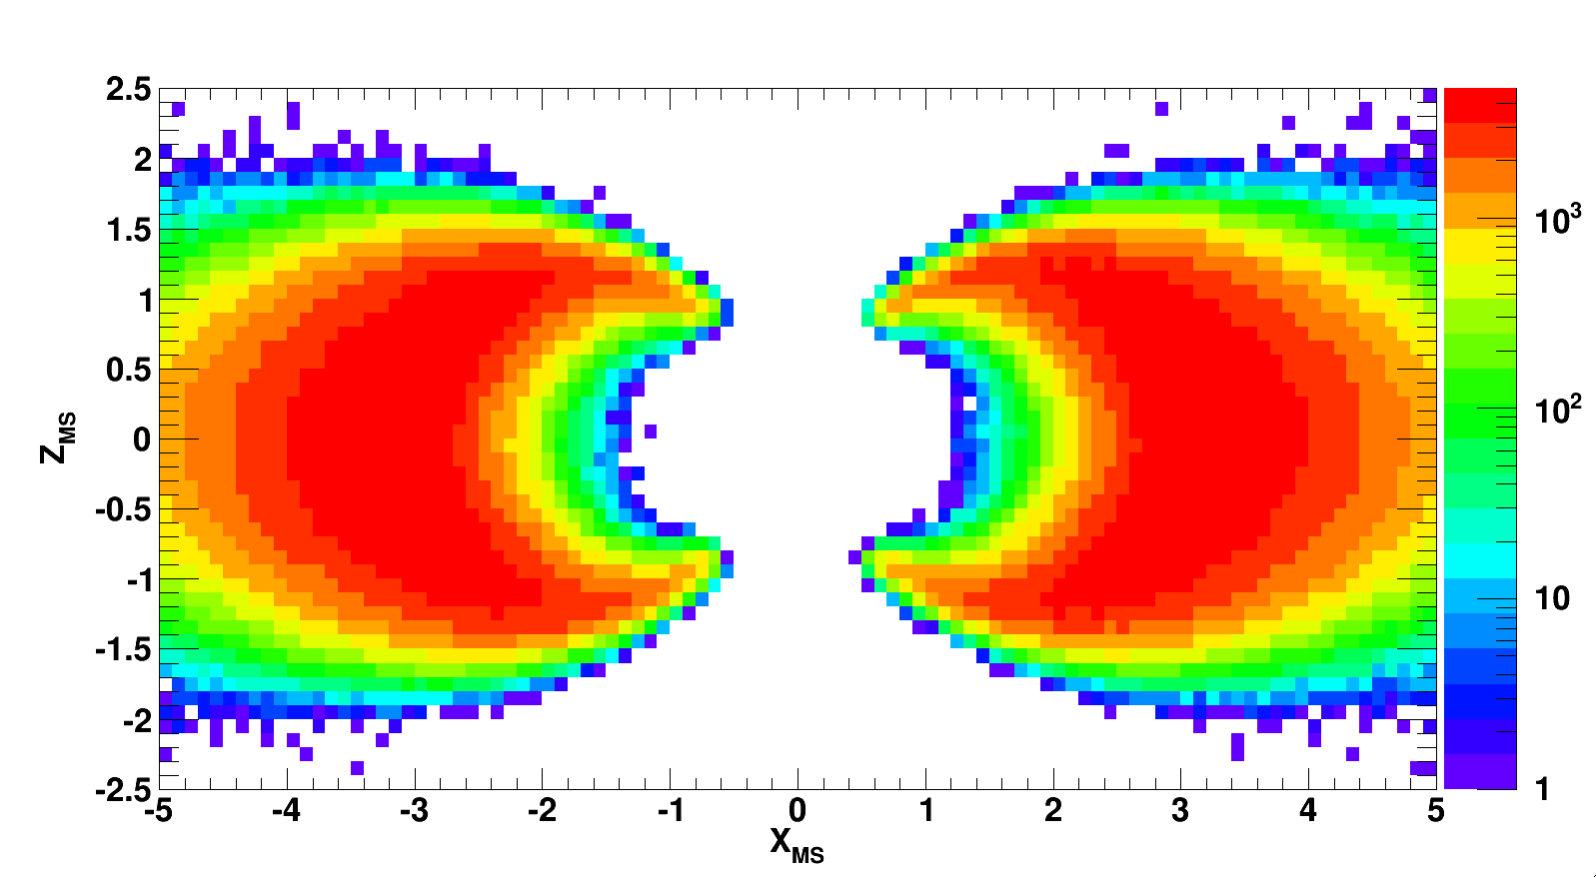
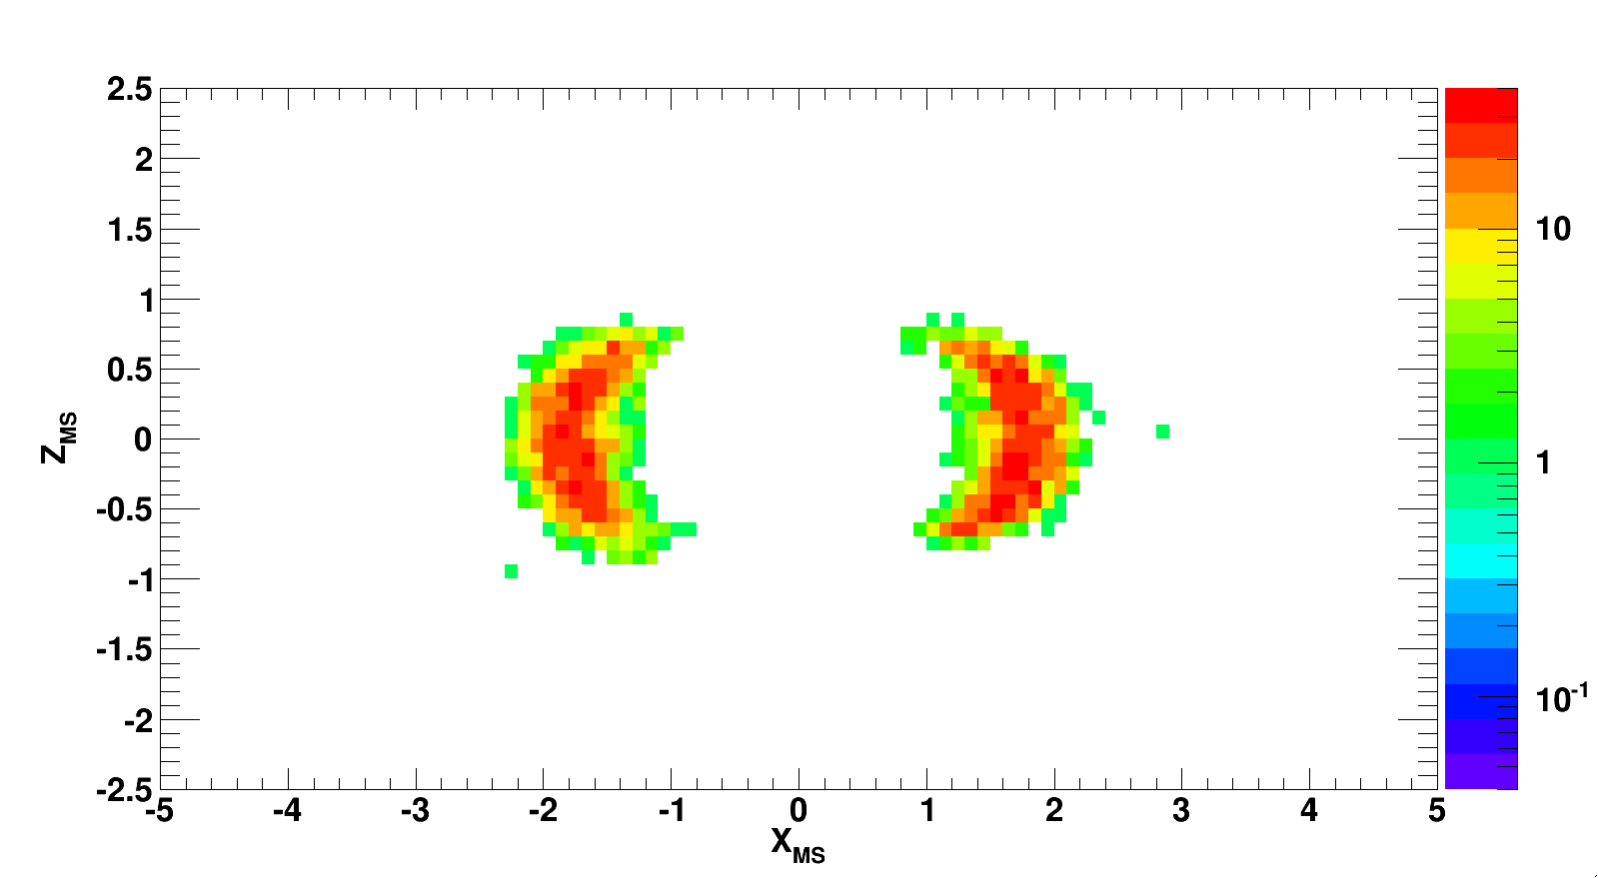
Fig. 1. Latitudinal and Longitudinal difference of the last point (magnetopause) for AMS-02 electrons in the rigidity range between 20 and 30 GV, for just internal IGRF ans TS05 models.
From P. Bobik et al. (2013) presented at ICATPP-2013 Conference: comparison with and without the external magnetic field compared with experimental data.
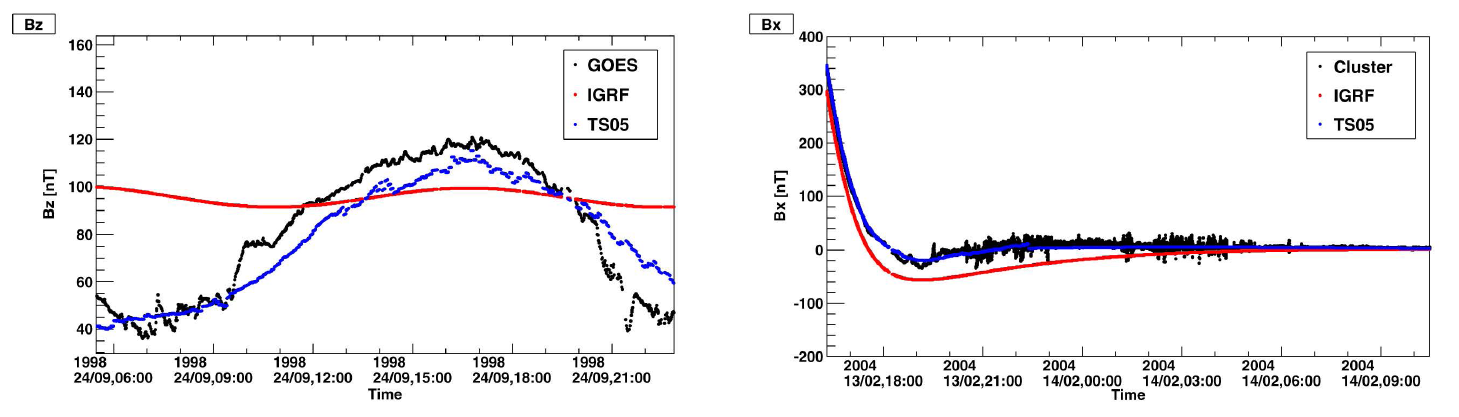
Fig. 1. Cluster and Goes B field components calculation comparison with measurements.
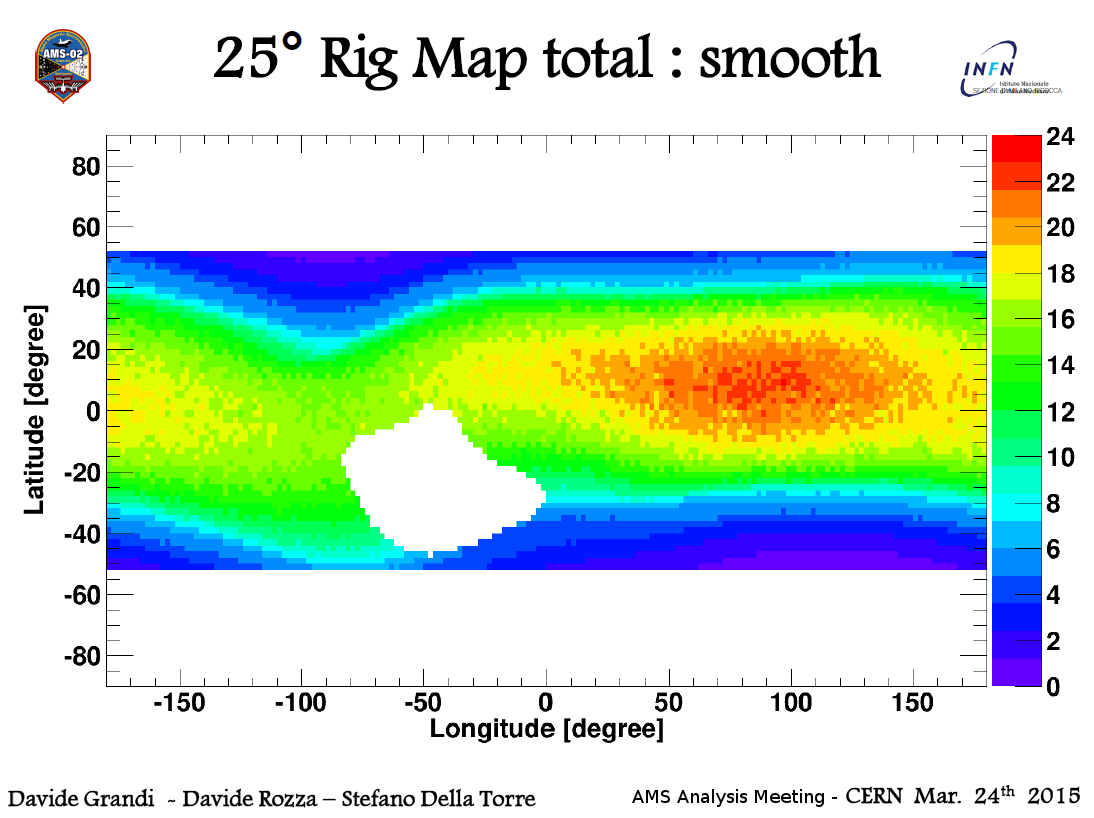
Average geomagnetic rigidity cut-off using AMS-02 backtraced protons as a function of the geographic coordinates.
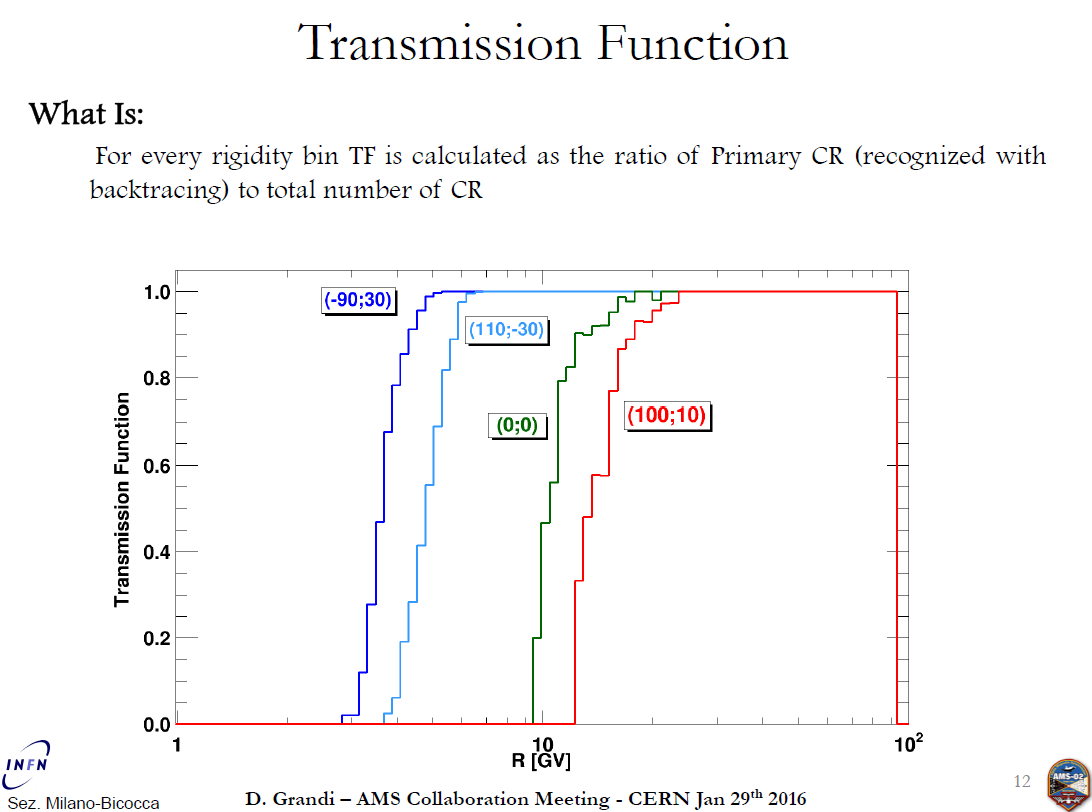
Transmission Function example for four geographic coordinates (longitude, latitude) using AMS-02 backtraced protons.
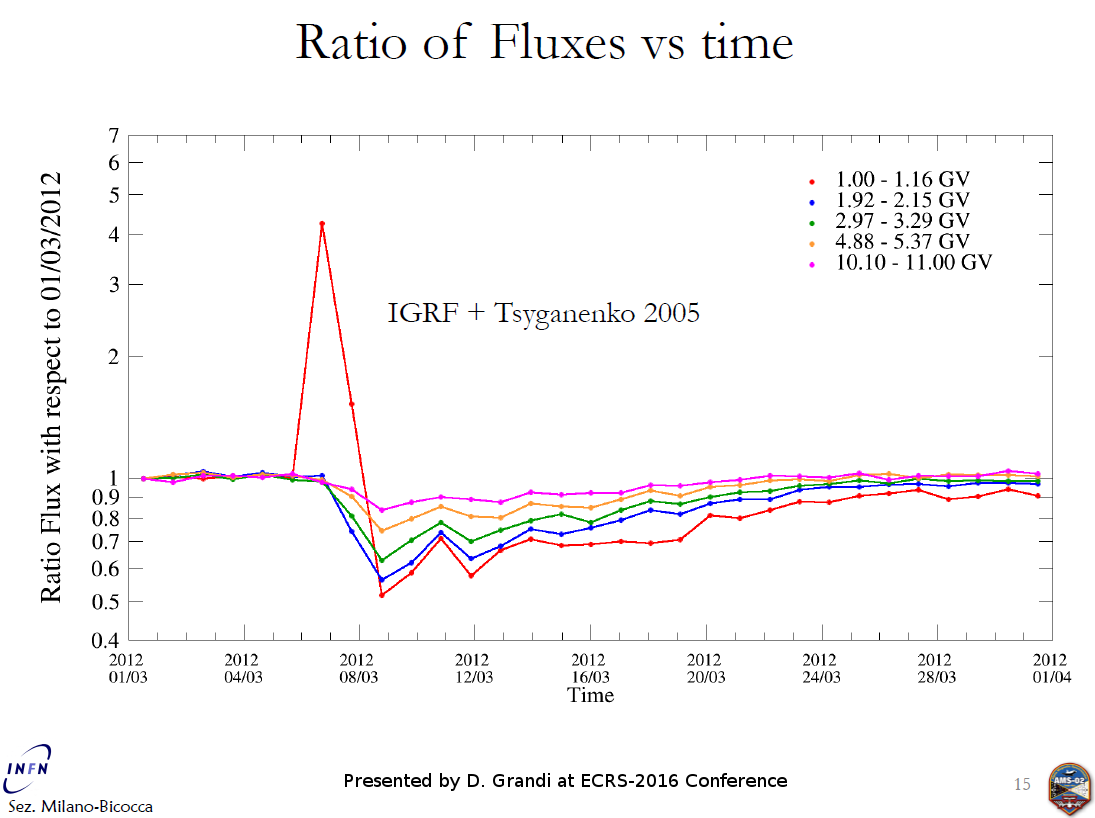
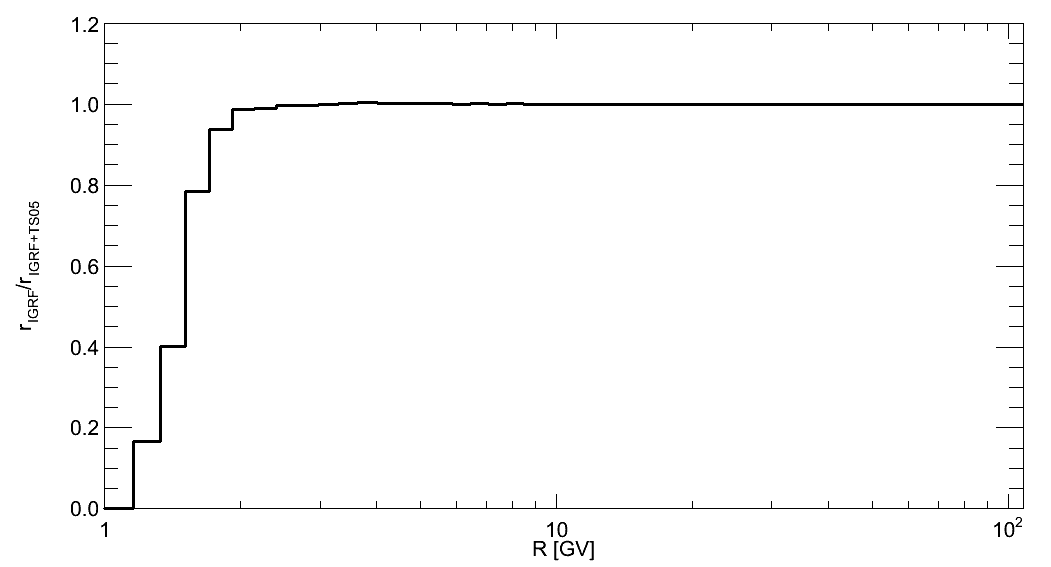
Example of solar proton analysis obtained from AMS-02 data using the geomagnetic cutoff due to both IGRF and TS05 magnetic field models